Key takeaway
In an oil-paper transformer, more than 95 % of the water lives in the cellulose, not the oil. The oil ppm you measure is a small, temperature-sensitive window onto that far larger paper reservoir — and the size of the window depends on the fluid. Esters hold much more water in the liquid phase, so for the same total water inventory at equilibrium the paper ends up drier in an ester-filled unit — not because the ester dries the paper, but because the oil acts as a larger reservoir. That advantage is real, and it is conditional: it is an equilibrium statement, the equilibrium is slow and temperature-driven, and water still attacks the ester itself by hydrolysis. This is the partitioning story, with the caveats that separate it from a fluid sales sheet.
The window and the room
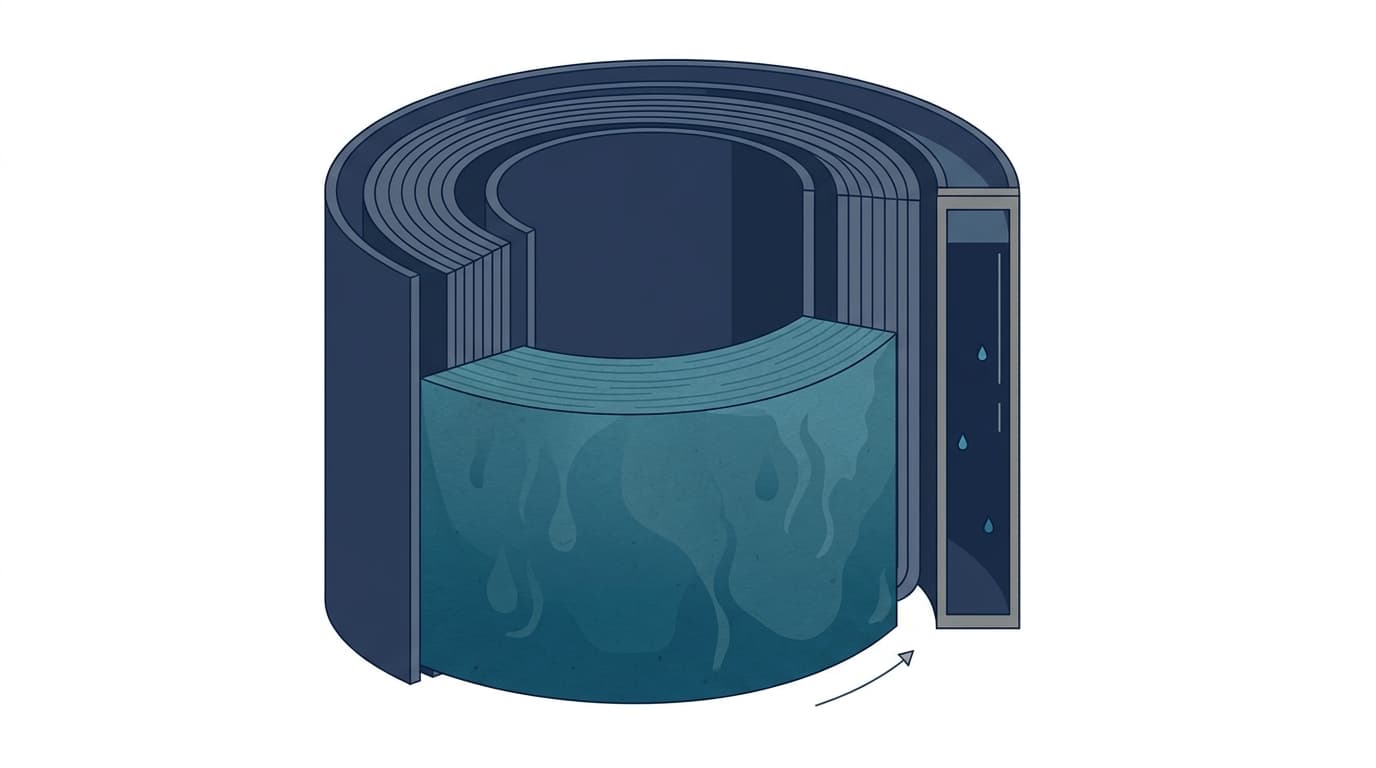
You measure water in the oil. But the oil is a window, not the room.
In a working oil-paper transformer the overwhelming majority of the water inventory — more than 95 % by mass at typical conditions — is held in the cellulose insulation, not in the fluid. The paper is the room; the oil ppm is a small pane of glass through which you glimpse it. A few parts per million in the oil can sit in equilibrium with paper carrying several percent water by weight.
That alone is worth internalising, because it reframes every oil moisture reading: the number is never the total inventory, only a window onto it. But there is a second twist that makes the window genuinely tricky. The size of the window changes with the fluid. The same paper moisture shows up as a very different oil ppm in mineral oil versus a synthetic ester — because the fluids differ enormously in how much water they will hold in the liquid phase. Read the wrong fluid's scale onto the window and you mis-size the room behind it.
That partition — between paper and oil, and how the fluid sets its terms — is what this article is about.
Same ppm, different paper: the four-fluid equilibrium
The single most useful picture in this whole topic is IEC 61203:2025's four-fluid equilibrium curve.

Read it the obvious way: at a fixed paper moisture, the equilibrium oil ppm climbs steeply from mineral oil, through silicone and natural ester, to synthetic ester. The ester is holding far more water in the liquid phase at the same paper condition.
Now read it the other way, which is the punchline: the same oil ppm corresponds to very different paper moisture depending on the fluid. A ppm that means "the paper is getting wet" in a mineral-oil unit can mean "the paper is fine" in a synthetic-ester unit. And in every case, the paper still holds the overwhelming majority of the water — the curve only tells you how the small remainder distributes into the oil.
One figure replaces a whole saturation league table. But it comes with limits printed right on it, and they are not fine print:
- Kraft paper only — not thermally-upgraded (TUK). The IEC 61203 curves explicitly exclude thermally-upgraded paper. Do not apply them to a TUK-insulated fleet.
- A single 50 °C snapshot. This is one temperature. The partition shifts with temperature, and this curve does not show that.
- Natural-ester coverage is thin — effectively a single point. Synthetic ester has a fuller temperature family in the standard; natural ester does not.
The mechanism — honestly qualified
Why do esters keep paper drier at equilibrium? The more polar ester holds more water in the liquid phase, so for a given total inventory the cellulose equilibrates to a lower moisture content. That is the whole mechanism. It is real, and it is the basis of the genuine condition-monitoring advantage ester units enjoy.
It is also where most writing on the subject stops, and where the honest account has to keep going — because four qualifications change how you should act on it.
It is an equilibrium statement. Ester oil-paper equilibrium is a slow pseudo-equilibrium, reached only when the fluid runs warm enough for long enough (IEC 61203:2025 Annex A.3, p. 27). A cool, lightly-loaded unit may never actually reach the equilibrium the curve describes. The advantage is a destination, not a guarantee about where you are today.
The ester does not actively dry the paper. It acts as a larger reservoir. The water is not pulled out of the cellulose by some affinity that beats the paper's; the partition simply settles at a point where more of the inventory sits in the oil. At high temperature the partition still drives water into the paper — the direction is set by temperature, the same as in mineral oil.
Water still attacks the ester itself. Dissolved water accelerates ester hydrolysis, producing acids and alcohols. So high moisture remains a fluid-chemistry concern in an ester unit even when the paper is comparatively protected — you have shifted the risk, not removed it.
At low temperature with a high inventory, esters still saturate. The larger reservoir is not infinite. A cold, wet ester unit can still approach saturation and form free water.
CIGRE TB 349 (2008) sets out the position that ester-filled units protect the paper and extend cellulose life, and that position is real and citable. Where vendors and the literature attach a magnitude to it — multi-fold life extension figures — treat those as vendor or literature claims, attributed as such. The qualitative protection is sound; the specific multiple is not ours to assert.
The retrofill story — partial, not magic
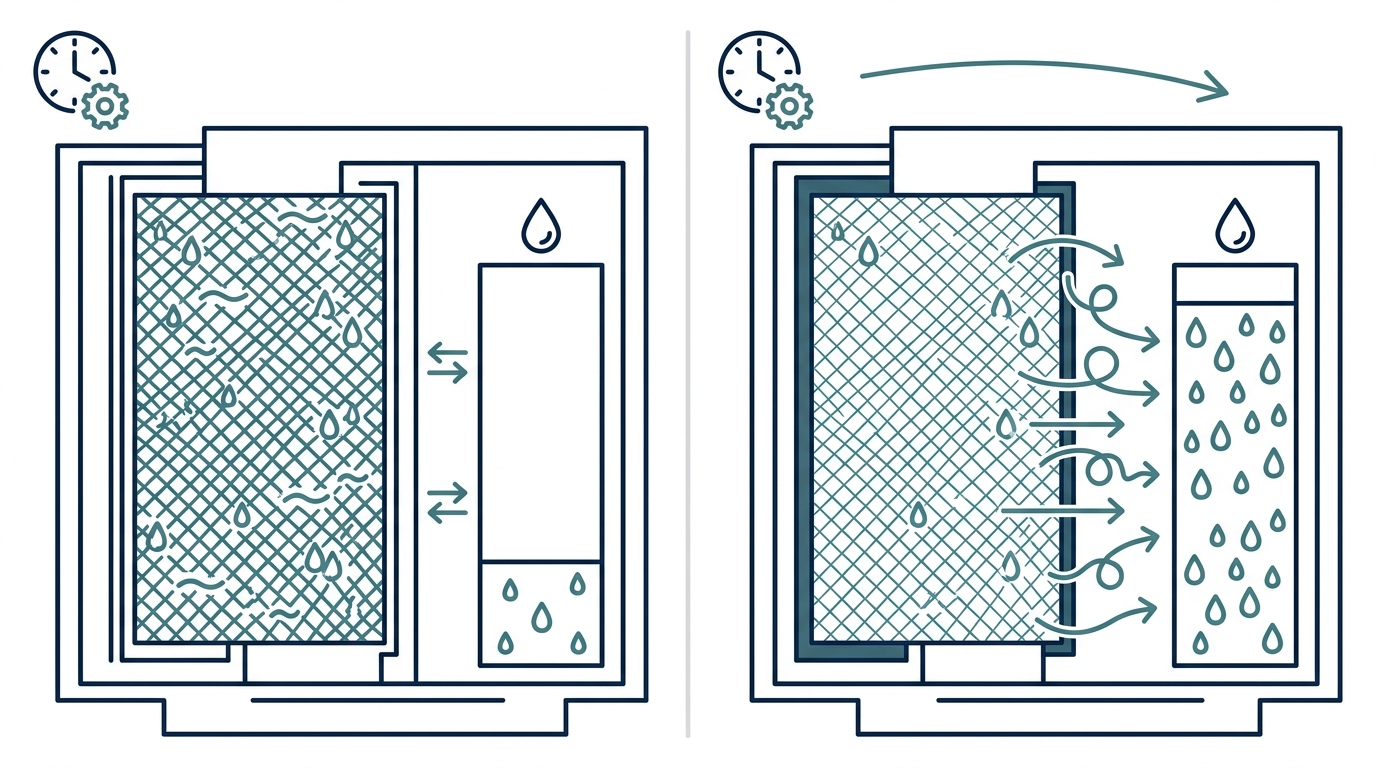
A mineral-to-ester retrofill is one of the more attractive interventions for an ageing fleet, and it is often oversold. IEC 61203:2025 Annex B describes the genuine effect: over time, water can migrate out of the Kraft paper into the ester, lowering the paper moisture, because the ester's larger liquid-phase reservoir pulls the equilibrium in that direction. Field studies report measurable paper drying after retrofill.
The honest framing has three parts.
The improvement is partial. Retrofill does not flush the old fluid completely; residual mineral oil stays soaked into the paper and does not share the ester's water affinity. The paper equilibrates toward a drier state, but from behind a mineral-oil residue that blunts the effect.
The migration is slow and temperature-driven. It runs on the same pseudo-equilibrium clock as everything else in this article — it needs sustained elevated temperature, and a cool unit dries slowly if at all.
It is not a substitute for a dry-out. Where the paper is already wet, retrofill shifts the equilibrium; it does not vacuum the cellulose. If the paper needs drying now for dielectric reasons, retrofill is not the tool.
The practical upshot: monitor %RS before and after a retrofill — and the paper-moisture trend too, where a legacy baseline exists — and expect gradual, partial improvement rather than a step change. Specify acceptance on %RS at a reference temperature, not on a bare ppm.
Caveats that change the answer
Gathered in one place, so the figure above cannot be mis-applied:
- Kraft only, not TUK. The IEC 61203 equilibrium curves exclude thermally-upgraded paper. A TUK fleet is outside their scope.
- Natural-ester temperature coverage is thin. The standard gives natural ester effectively one 50 °C point; its equilibrium at other temperatures is genuinely unresolved in the published data. Synthetic ester has a 20/60/90 °C family; natural ester does not. We state this as a limitation rather than reach for a secondary curve to fill it.
- Aged oil shifts the curve. New-oil equilibrium curves can overestimate paper moisture by roughly a factor of two on aged mineral oil (CIGRE TB 323). Esters add hydrolysis products that change the fluid's polarity over time too. Treat new-oil curves as an upper bound, not a readout, on aged units.
- Equilibrium is rare in service. IEC 61203:2025 itself describes oil-paper equilibrium as very rarely — if ever — actually reached operationally. These curves are an idealisation for interpretation, not a live measurement of your transformer right now.
None of these cancels the ester advantage. They bound it. An engineer who knows the bounds gets the benefit without overpromising it to an asset owner.
What to do with this
The operational distillation:
- Treat oil ppm as a window onto the paper, never as the total inventory. More than 95 % of the water is in the cellulose; the oil reading is the small remainder.
- For mixed fleets, rank on %RS, not ppm. It is the only unit comparable across mineral and ester units — the argument the companion article makes in full.
- For ester units and retrofills, expect partial, slow, temperature-dependent paper drying. Specify %RS acceptance at a reference temperature and monitor the trend through it.
💡 Tip
Sidebar — which saturation number to trust. Two legitimate datasets disagree by 30–40 %. The IEC-harmonised set (mineral ~53, silicone ~192, natural ester ~925, synthetic ester ~1,880 ppm at 20 °C) is the cross-fluid default and the right denominator when you do not know the exact product. The vendor/CIGRE product-specific set (synthetic ester ~2,700 ppm for Midel 7131 or ~2,600 generic; natural ester ~1,100 ppm at 23 °C) is the right denominator when the actual fill is known and named. Neither is wrong — they answer different questions. Whichever you use, state which model any %RS was computed against. This is a footnote to the partitioning story, not its spine.
The shared fluid-neutral RH calculator below converts ppm to %RS across all four fluid families, with the saturation coefficients shown for transparency — useful for sizing the window before and after a retrofill.
Moisture & relative-saturation calculator
Compute %RS, ppm-at-reference, free-water temperature and estimated paper moisture from a Karl Fischer reading, per IEC 60422:2024 / 61203:2025 / 62975:2021.
Saturation and %RS use the IEC harmonised averaged-literature coefficients (Table A.1); vendor/product data can run 30–40 % higher. Paper-moisture %WCP is read off a digitised equilibrium graph (Kraft paper only) — present it as approximate, not a measured value.
Weighing an ester retrofill? Send us the unit's DGA, online sensor logs, and lab moisture history, and we will give you a lab-and-vendor-neutral read on how much of the ester advantage is real for your paper — and whether a retrofill or a dry-out is the right move.
For the underlying argument on why ppm is the wrong unit to compare in the first place, start with the pillar piece: Why Your ppm Water Number Lies — and What %RS Tells You Instead.
Standards referenced
The methods on this page are anchored in these standards — follow each into our standards library.
Put Theory into Practice
Try our interactive Duval diagnostic tools or use our new unified workflow to analyze your transformer oil data.