
Audio player docked to bottom
Listen to this article
Key takeaway
A transformer oil sample is a measurement, not a parcel. Hydrogen, the earliest fault gas, has an Ostwald solubility coefficient of 0.0556 in mineral oil. In a 100 mL bottle holding 95 mL of oil and 5 mL of trapped air, 49 % of the dissolved hydrogen migrates into the headspace before the lab opens the seal. Methane drops by 11 %, carbon monoxide by 29 %. The losses are selective, not uniform — and selective loss flips diagnostic coordinates. A constructed thermal fingerprint sitting on the T2/T3 boundary of Duval Triangle 1 measures as T3 after a 5 mL headspace loss — a 2-percentage-point shift in %C₂H₄ that crosses the 50 % zone line and changes the diagnosed hot-spot temperature band from 300–700 °C to over 700 °C. Same transformer, two different diagnoses, driven entirely by 5 mL of air. The IEC 60475 procedure that demands real zero-headspace at the moment of sealing — either by pressing the sides of a flexible aluminium bottle before capping, or by letting a glass syringe plunger ride the oil — is not pedantry. It is the physics of correct measurement. Top-filling discipline is the control; the choice of container is secondary.
1. A liquid is harder to sample than it looks
A transformer is full of oil the way a settling tank is full of water — superficially uniform, structurally heterogeneous. Density gradients pull free water to the bottom. Cellulose fibres, copper-corrosion particles and oxidation sludge settle. Dissolved gases concentrate near the source of the fault. Air ingress at the conservator skews the top of the column. The diagnostic instruments downstream of the sample — gas chromatography, Karl Fischer titration, breakdown-voltage rigs, dielectric dissipation factor — assume a single composition. They are blind to where in the tank the sample came from.
The standards that govern sampling — IEC 60475:2022 for the procedure, IEC 60567:2023 for DGA preparation, ASTM D923 in parallel jurisdictions — exist to convert that heterogeneous reality into a single defensible number. The procedure is not aesthetic. Each step compensates for one specific physical process.

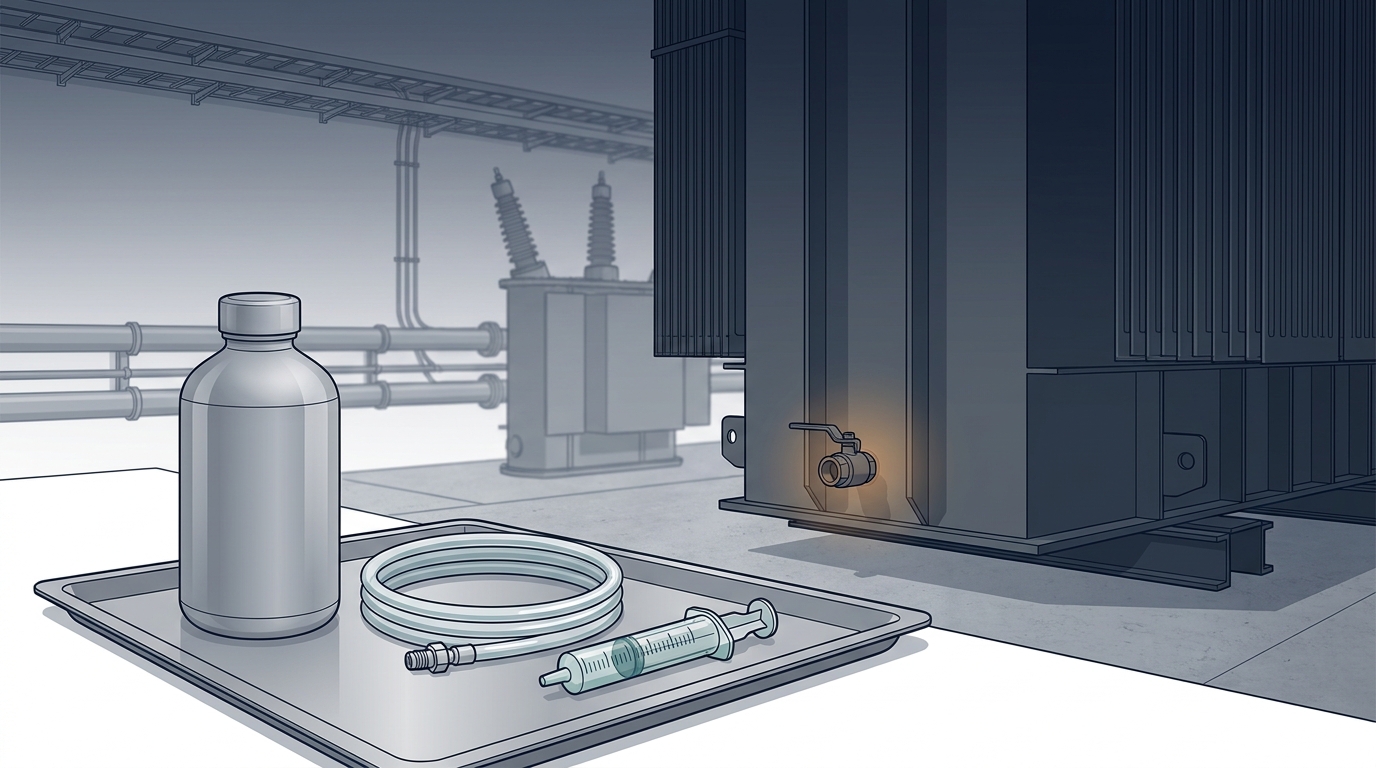
The bottom-drain valve is the canonical sample point because it represents the least favourable condition in the tank — the location where the fluid most likely to fail (water, particulate, cooler oil) accumulates. That is why every standard agrees on bottom-valve sampling (IEC 60475:2022, §4.2.1.2; ASTM D923-15 (R2023), §5.3.1). It is also why a sample drawn from an upper conservator port is not equivalent and not interchangeable.
2. IEC 60475 in practice — what each step is actually doing
The six-step field procedure on our oil sampling guide walks a technician through prepare → flush → rinse → fill → seal → finalise. Behind each step there is a physical reason that, once seen, makes the procedure feel less like ritual and more like instrumentation.
Two-stage flush. IEC 60475:2022 calls for the flush in two distinct stages, each with its own physical job. First, at the drain valve itself: 2 to 5 L under turbulent flow (§4.2.1.3, p. 14) — "a sufficient quantity of oil (typically, 2 l to 5 l), under a turbulent flow, to eliminate any contaminants (water and particles) that might have accumulated in the drain valve and at its orifice." Second, through the sampling line into a waste container: a further 1 to 2 L (§4.2.2.2 step b, p. 20). The two stages do different work. The turbulent first stage mobilises accumulated water droplets and particulate that have settled in the valve orifice and can otherwise sit there for years between samplings; the laminar second stage replaces the dead-volume oil in the sampling tube without re-entraining air. Volume exchange alone is the easy part; the turbulent regime at the valve is the part that carries the contamination out.
When the standard's numbers fit, and when judgment refines them. The standard is provisioned conservatively for the worst case it must cover. A consulting practice refines that provisioning to the unit in front of you. The 2–5 L turbulent specification does two things at once: it eliminates water and particulate accumulated in the valve dead-volume — critical for breakdown voltage and water-content measurements — and it forces the flow regime that mobilises whatever has settled in the orifice. Both reasons are strong on a unit that is unfamiliar, has not been sampled regularly, has a documented BDV or water-content concern, or is being sampled for the first time after an oil change or other intervention. Both reasons are weaker on a unit that is sampled regularly with a documented clean drain valve, where the question on the order is DGA trending rather than dielectric integrity. There is also a physical limit. On a compact, hermetically sealed transformer with passive head pressure and a viscous fluid — natural ester at roughly 30–40 mm²/s at 40 °C, three to four times mineral-oil viscosity — the turbulent regime the standard asks for may not be achievable at any reasonable flush volume. Pushing 5 L through such a valve in pursuit of a Reynolds number that physics will not allow is not best practice; it is oil loss in service of a flow condition that does not arrive. On units of that class, where the drain valve is known clean and the diagnostic question is gas trending, 0.5 to 1 L of total preflush with the sampling line connected is sufficient for a representative DGA sample. That call belongs to the sampling technician, made deliberately on the unit's history and physical configuration, not adopted as a default. When the unit is unfamiliar or the question is BDV or water, the upper bound is the right number and the oil cost is the price of a defensible measurement.
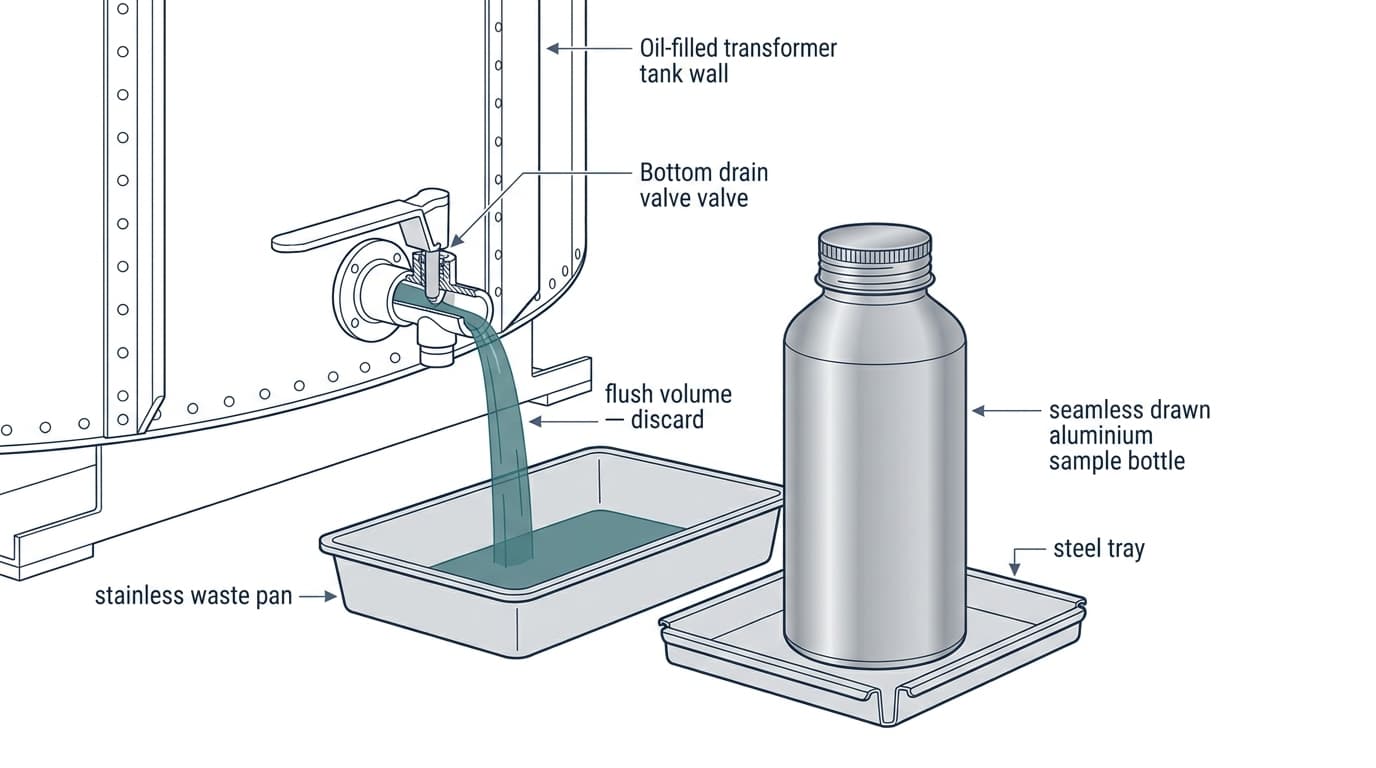
Bottom-fill via a hose to the bottom of the container. When the sample finally goes into a bottle, IEC 60475 (§4.2.4 / §4.2.5) routes it through a hose whose outlet sits at the bottom of the container. Oil fills the bottle from below, displacing air upward through a single exit path — the bottle never has free oil cascading through air. Any cascade would dissolve atmospheric N₂ and O₂ into the sample and lift dissolved fault gases out of it.
Two-volume overflow. The container is then overfilled by at least twice its own volume to wash out the last of the original air. Cap the bottle inside the overflow stream, and the only fluid trapped against the closure is fresh oil from the live tank.
Cap rinse. The cap is rinsed in oil before it goes on, so no atmospheric film clings to the seal area.
These five disciplines do one job: they minimise the air-to-oil contact area at every moment between the tank and the closed bottle. The reason they matter is in section 4.
3. The container — what actually solves the headspace problem
Containers fall into four categories that map onto four different relationships with the gas-loss mechanism.
Plastic bottles. Plastic walls are permeable to small molecules. Hydrogen and methane diffuse out through PE and PET on the timescale of days, regardless of how well the bottle is sealed. Plastic also adsorbs water onto its inner surface, biasing Karl Fischer measurements. IEC 60475:2022 (§4.2.1.5, prose after Table 2, p. 18) prohibits plastic bottles for DGA, water and dielectric strength. Plastic is not a budget option for these tests; it is wrong.
Rigid glass bottles. Glass is gas-impermeable on transport timescales and chemically inert. Its weakness is rigidity. IEC 60475:2022 (§4.2.5.2) explicitly mandates that a rigid bottle leave 1.5–3 cm of headspace — typically 3.5 to 7 mL — to absorb thermal expansion of the oil between a hot transformer and a cool lab without breaking the bottle. That headspace is non-negotiable for safety. It is also where the diagnostic damage in section 4 occurs.
Drawn-aluminium bottles, topped to the brim. This is the operationally robust answer to the partition problem. IEC 60475:2022 (§4.2.4.1 a)) reads: "Metal bottles made of drawn aluminium or of welded tin are flexible and do not need oil expansion devices. They should be filled completely with oil by pressing on the bottle sides before closing the bottle." The bottle is topped, the sides are pressed inward to expel residual air, and the cap is screwed down inside the overflow stream. The wall then flexes outward when the oil warms and inward when it cools — the bottle skin does the job a syringe plunger does, but distributed across a much larger flexible surface. The residual headspace at the moment of sealing is genuinely zero. The bottle is robust in the field, packs into shipping crates without a fragility budget, opaque to light (an advantage for photo-sensitive fluids), and survives being dropped onto steel grating from a wind-turbine catwalk. The seamless drawn construction — one piece of metal, no seam, no flux — is what both IEC 60475 §4.2.4.1 (a) ("drawn aluminium or welded tin") and ASTM D923-15 (R2023) Appendix X2 (which lists the same vessel as "seamless aluminum can") accept.
Glass syringes. A matched-piston-and-barrel glass syringe per IEC 60475:2022 (§4.2.2.1) achieves the same zero-headspace condition by a different mechanism. Step 4.2.2.2 c) describes the filling: "the plunger should not be withdrawn but allowed to move back under the pressure of the oil." Any stray air bubble is expelled before sealing, and the transport carrier is designed to "hold the syringe firmly in place during transport but [allow] the syringe plunger freedom to move" (IEC 60475:2022, §4.2.2.1 b)). When the oil cools 30 °C between transformer and lab, the plunger retracts; when it warms, the plunger extends. IEC 60475:2022 (§4.2.4.1 a)) specifies a quantitative integrity criterion: an acceptable container must lose less than 2.5 % of its hydrogen content per week. All-glass syringes routinely pass; correctly filled drawn-aluminium bottles also pass — the criterion is on the container family, not the material.
The glass syringe and the topped aluminium bottle are two implementations of the same physical principle: at the moment of sealing, and a degree of freedom (plunger or wall) that lets the volume track thermal swings without breaking the seal. They are diagnostically equivalent. We have run side-by-side measurements on the same transformer through the same drain valve into both containers, and the DGA fingerprints come out the same. The Ostwald model does not care which container the oil sits in — it cares only about .
![Three containers, three different relationships with the headspace problem. The topped aluminium bottle (flexed [[V_G \approx 0]]) and the glass syringe (plunger-mediated [[V_G = 0]]) are two implementations of the same zero-headspace principle and are diagnostically equivalent. A rigid bottle left with 5 mL of air is the configuration the Ostwald argument warns against.](/images/blog/sampling-physics/sampling-physics-three-containers-svg-en-v1-97cd78ef.svg)
What our cross-check shows
TriboTech has sampled the same transformer through the same drain valve into both a correctly topped drawn-aluminium bottle and an all-glass syringe back-to-back, and run both through the same DGA chain. The dissolved-gas fingerprints come out identical within analytical repeatability — same H₂, same CH₄, same CO, same diagnostic conclusion. The empirical evidence supports what the physics already says: the variable is , not the container material. Top-filling discipline is the critical control. Container choice is secondary.
That observation is what makes the field default an aluminium bottle. One sampling event, one bottle, the full panel. A 1 200 mL drawn-aluminium bottle, topped to the brim and pressed on the sides before capping, holds enough oil for DGA, the full general-properties panel (water, BDV, DDF, IFT, AN, viscosity, fire point) and any special tests the asset owner has asked for. A 120 mL drawn-aluminium bottle, same construction, holds enough for DGA alone when DGA is the only test on the order. The glass syringe stays in the kit as a backup — for clients whose acceptance protocol specifies it, for samples where the field environment makes confident top-filling difficult, or for hydrogen-rich fault investigations where a third party may later want a syringe-format sample on file. The pragmatism is honest: we do not present the syringe as "better physics" because it is not. It is the same physics, in a different format, that is harder to keep robust through field handling than a flexible bottle pressed flat before capping.
4. Ostwald in numbers — why 5 mL of headspace flips a diagnosis
This is the section that justifies the procedure.
The Ostwald solubility coefficient is the ratio of a gas's concentration in oil to its concentration in the gas phase at thermodynamic equilibrium (IEC 60567:2023, Annex A, Table A.1). It is best understood as a distribution: where the molecules sit when the system is at rest.
![Ostwald solubility coefficient as a distribution ratio at thermodynamic equilibrium between equal-volume oil and gas phases. With 200 molecules total: hydrogen ([[k_O = 0.055]]) sits almost entirely in the gas phase; acetylene ([[k_O = 1.2]]) distributes nearly evenly. Same total amount of dissolved gas, very different escape behaviour when a rigid headspace is present.](/images/blog/sampling-physics/sampling-physics-ostwald-distribution-en-v1-037f9547.svg)
The values for the diagnostic gases in mineral oil at 25 °C are:
| Gas | |
|---|---|
| Hydrogen (H₂) | 0.0556 |
| Nitrogen (N₂) | 0.0907 |
| Carbon monoxide (CO) | 0.132 |
| Oxygen (O₂) | 0.172 |
| Methane (CH₄) | 0.429 |
| Carbon dioxide (CO₂) | 1.09 |
| Acetylene (C₂H₂) | 1.24 |
| Ethylene (C₂H₄) | 1.84 |
| Ethane (C₂H₆) | 2.82 |
(Source: IEC 60567:2023, Annex A, Table A.1, p. 53. ASTM D3612-02 (Reapproved 2026), §31 / Table 6, p. 16, reports partition coefficients at 70 °C in Voltesso 35 that differ from the IEC values above by up to ~33 % — H₂ by +33 %, C₂H₆ by −26 %, C₂H₄ by −20 %. The spread illustrates that partition coefficients are temperature- and base-oil-sensitive; the IEC table is at 25 °C across "current types of mineral insulating oil", the ASTM table at 70 °C in a specific oil.)
The smaller is, the less the gas wants to stay in oil and the more readily it migrates into any contacting gas phase. Hydrogen — the gas that signals partial discharge and incipient electrical fault, the earliest warning of insulation distress — has the smallest of all the diagnostic gases.
For a sealed sample bottle holding of oil and of headspace, mass conservation gives the fraction of each gas that remains in the oil phase at equilibrium:
(Mass-balance derivation: ASTM D3612-02 (Reapproved 2026), §27.1, equations (14)–(17), pp. 13–14. The equivalent back-correction form appears in IEC 60567:2023, Annex D, p. 58.)
The model assumes an initially gas-free headspace; atmospheric backflow (O₂, N₂, trace CO₂ entering from air) is treated separately in the asymmetry discussion below.
For a 100 mL bottle holding 95 mL of oil and 5 mL of trapped air ( mL, mL — a 5 % void fraction, more aggressive than a typical 1–2 L laboratory bottle but representative of a poorly-filled sample container), the table looks like this:
| Gas | (%) | (%) | |
|---|---|---|---|
| H₂ | 0.0556 | 51.4 | 48.6 |
| N₂ | 0.0907 | 63.3 | 36.7 |
| CO | 0.132 | 71.5 | 28.5 |
| O₂ | 0.172 | 76.6 | 23.4 |
| CH₄ | 0.429 | 89.1 | 10.9 |
| CO₂ | 1.09 | 95.4 | 4.61 |
| C₂H₂ | 1.24 | 95.9 | 4.07 |
| C₂H₄ | 1.84 | 97.2 | 2.78 |
| C₂H₆ | 2.82 | 98.2 | 1.83 |
![Selective gas loss to 5 mL of headspace in a 95 mL oil sample at 25 °C. Computed from [[f_{\text{lost}} = V_G / (k_O \cdot V_L + V_G)]], using [[k_O]] values from IEC 60567:2023 Annex A Table A.1 and the mass-balance derivation in ASTM D3612-02(R2026) §27.1, eq. 14–17. Per-gas [[k_O]] and [[f_{\text{lost}}]] are tabulated above.](/images/blog/sampling-physics/headspace-loss-bars-v1-12d21289.svg)
The headline is not the magnitude of the loss. It is the selectivity of the loss. The light, low-solubility gases — H₂, N₂, CO, O₂ — are stripped preferentially. The heavy hydrocarbons and CO₂ stay in the oil. A laboratory that opens the bottle and analyses the oil portion sees a fingerprint that has been shifted, gas-by-gas, away from what was dissolved at the moment the bottle was sealed. The shifts go the wrong direction for diagnostic accuracy: H₂, CH₄ and CO are the early-warning indicators.
Single-gas headspace loss calculator
Pick a fault gas, drag Sample Volume and V_G, and see the partition shift through a live syringe animation and a magnifier of the molecular distribution.
The diagnostic consequence shows up where the fingerprint is plotted. Apply the values above to a constructed thermal-fault fingerprint (seven gases, sitting just inside the T2 band of Duval Triangle 1) and recompute the IEC 60599:2022 quantities:
Illustrative example, constructed fingerprint
Gas True (μL/L) Measured after 5 mL headspace (μL/L) H₂ 70 36.0 CH₄ 280 249.4 C₂H₂ 12 11.5 C₂H₄ 280 272.2 C₂H₆ 70 68.7 CO 300 214.5 CO₂ 2 250 2 146.4
Duval Triangle 1 coordinate True Measured Shift Zone %C₂H₄ 48.95 % 51.06 % +2.11 pp T2 → T3 %CH₄ 48.95 % 46.78 % −2.17 pp — %C₂H₂ 2.10 % 2.16 % +0.06 pp — Same transformer, same dissolved gases, two diagnoses. The true fingerprint sits at %C₂H₄ = 48.95 % — just inside the T2 band of Duval Triangle 1, hot-spot 300–700 °C (IEC 60599:2022, Figure B.3, p. 37). After 5 mL of headspace, the measured %C₂H₄ rises to 51.06 % — across the 50 % line, into T3, hot-spot above 700 °C (IEC 60599:2022, §3.2.2, p. 11). The driver is selective partitioning: CH₄ () loses 10.9 % of its mass to the headspace while C₂H₄ () loses only 2.8 %. The denominator of the Duval coordinate falls faster than the numerator, and the fingerprint walks across the zone line.
The flip lives on the Duval Triangle 1 graphical representation, not on the IEC 60599:2022 Table 1 ratio classification. Table 1 alone would call this fingerprint T2 both before and after — C₂H₂/C₂H₄ stays at ~0.04, CH₄/H₂ runs from 4.00 to 6.94 (+73 %, with no upper bound on CH₄/H₂ for the T2 and T3 thermal bands per IEC 60599:2022, Table 1, p. 14), and C₂H₄/C₂H₆ drifts from 4.00 to 3.96, still inside the 1–4 T2 band. The danger is more subtle than a tabulated-ratio flip and shows up where most asset teams actually read the result: on the graphical Duval triangle that sits in the report.
A second category drift goes the same direction. For a fingerprint with true CO₂/CO = 7.5, the measured value rises to 10.01 — landing essentially on the IEC 60599:2022, §5.5, p. 15 boundary: "high values of CO₂ (> 10 000 ppm) and high CO₂/CO ratios (> 10) can indicate mild (< 160 °C) overheating of paper or oil oxidation, especially in open transformers". The absolute CO₂ caveat still applies, but the ratio crosses cleanly. This is a soft boundary with multiple confounders, but it changes the recommended follow-up — furanic-compound analysis (IEC 61198) versus oil-oxidation testing — even when no fault classification has changed in Table 1.
This example is constructed from the partition equation, not measured field data. The fingerprint was selected to sit exactly on the T2/T3 boundary of Duval Triangle 1 so the headspace shift crosses the zone line cleanly. It is offered as a pedagogical illustration of the direction and magnitude of the diagnostic drift, not as a TriboTech case study.
What the model assumes — and what air actually contains
The Ostwald distribution above treats the headspace as a neutral gas reservoir. In practice, the headspace in a poorly topped bottle is atmospheric air — and the composition of the atmosphere creates an asymmetry that matters when reading the result.
Atmospheric air carries O₂ at ~21 %, N₂ at ~78 %, CO₂ at ~420 ppm, methane at ~1.9 ppm, and effectively zero of the higher hydrocarbons (C₂H₂, C₂H₄, C₂H₆). For O₂ and N₂ the partitioning runs in both directions — a bottle with trapped air can lose dissolved O₂ and N₂ to the headspace or gain them from it, depending on what the oil arrived with. Measurements of O₂ and N₂ on a poorly topped sample are unreliable in either direction.
For the fault gases the asymmetry is one-sided. Atmospheric air has no acetylene, no ethylene, no ethane — and methane only in barely-detectable trace. The headspace can only pull hydrocarbon fault gases out of the oil; it cannot put them back. Sampling error can under-report a fault, never invent one.
This answers a question we hear often: "Could the elevated methane in our DGA be sampling contamination?" No. The atmosphere has no methane to give. Elevated fault gases are real. The only way poor sampling distorts a hydrocarbon diagnosis is by under-reporting it.
The procedure in section 2 — the two-stage flush, the bottom-fill, the 2× overflow, the side-press, the cap rinse — exists because this drift is structural. Once the air is in the bottle, no laboratory correction can fully undo the damage. The lab can apply a per-gas headspace correction (IEC 60567:2023 Annex D gives one form) only if it knows accurately, which it almost never does at the level of fidelity the back-calculation needs.
The right answer is to remove the headspace at the source. The Ostwald model does not say "use a glass syringe"; it says "make zero before sealing, and keep it zero through transport." A drawn-aluminium bottle filled to the brim, with the sides pressed inward before the cap goes on, satisfies that condition. So does an all-glass syringe with the plunger riding the oil. Either is diagnostic-grade. A rigid bottle left with 5 mL of air is not.
5. The TriboTech choice — sampling economy that does not compromise the physics
There is a design philosophy underneath the kit list. We optimise for diagnostic relevance in the field, not laboratory-perfect sub-ppm sensitivity, and we build the procedure around the constraint that one sampling event has to deliver everything the asset team needs.
The Ostwald argument above is sharp at the level of fault detection — the difference between a T1 and a T2 classification, the difference between flagging cellulose involvement and missing it. It is not a sub-ppm argument. Once the sum CH₄ + C₂H₄ + C₂H₂ exceeds roughly 100 ppm, the Duval Triangle 1 and the IEC 60599 ratios become diagnostically active and the condition matters operationally. Below that threshold the fingerprint is in baseline territory, the population variance dominates, and chasing parts-per-billion precision is academic gloss.
So we draw the line at the level the physics actually cares about:
- Drawn-aluminium bottle as the field default. A 1 200 mL bottle delivers the full panel (DGA + general properties + any special tests) from a single sampling event; a 120 mL bottle covers DGA alone when that is all the order specifies. Topped to the brim, sides pressed before capping — at the moment of sealing.
- Glass syringe as the backup option. Used when the client's acceptance protocol specifies a syringe-format sample, when hydrogen-rich faults are under active investigation, or when field conditions (cold, vibration, awkward access) make confident top-filling of a flexible bottle difficult. Not "better physics" — same physics, different implementation, harder to handle robustly in the field.
- Bottom-valve sampling under representative load. No conservator-port substitutes.
- Two-stage flush, bottom-fill, 2× overflow, cap rinse. Always.
- Duval and IEC 60599 ratios switched on when Σ(CH₄ + C₂H₄ + C₂H₂) ≥ 100 ppm. Below that, we monitor for trend — we do not over-classify.
What we will not pretend to deliver: ppb-level sensitivity on every sample, perfectly preserved gas inventory measured to two decimal places, or a result that is more precise than the diagnostic framework can use. The diagnostic frameworks have been calibrated on data that contains the same sampling realities ours does. A measurement system delivering more decimal places than the framework consumes is engineering theatre.
What we will deliver: a sample whose gas inventory has not been stripped by 47 % on H₂ before it ever reaches the chromatograph, in a container that the asset owner's lab can re-receive without a separate handling protocol per test. One sampling event, one bottle, full panel. That is the difference between a defensible diagnosis and a phantom one — and it is also the difference between a sampling programme that scales across a transformer fleet and one that demands a new kit configuration every time a different test is added.
Multi-gas Duval drift
Pick a fault fingerprint, watch true vs measured points drift across Duval Triangle 1 and Pentagon Unified zones as V_G grows. Verified fingerprints from IEC 60599:2022 and CIGRE 2023.
We hold the line on edge cases. If a sample arrives with an anomalous gas-by-gas pattern, depleted H₂ relative to CH₄, or a CO₂/CO that drifted in the wrong direction between two consecutive samples without a corresponding change in transformer condition, we look at the sampling chain first. Sampling artefacts are common; transformer faults are not. The likeliest explanation for a sudden one-shot anomaly is a 5 mL air gap that crept in because the sides of the bottle were not pressed before the cap went on, not a new failure mode.
6. How we read the standard in the field
We do not recite IEC 60475. We help asset owners navigate it. The standards exist because the worst-case unit, sampled by the worst-trained crew, on the worst day, must still produce a defensible result. That is the right design choice for a published procedure — it has to cover everything from a 60-year-old unknown breather transformer with a corroded drain valve through to a brand-new compact hermetic unit with a clean orifice and a known sampling history. The conservative number is the right number when nothing else is known.
A consulting engagement adds what the standard cannot: the specific unit in front of us, its sampling history, what the previous samples show, what the asset team is actually trying to learn from this round of testing, and the physics that govern what is achievable at this valve on this fluid at this temperature. With that context, the same procedure refines into one of two operating points.
| Use the upper bound (2–5 L drain flush + 1–2 L line flush) | Use field judgment (0.5–1 L total preflush) |
|---|---|
| First sample on an unfamiliar or newly acquired unit | Unit sampled regularly, no current BDV or water concerns |
| Irregular or undocumented sampling history | Documented clean drain valve from prior sampling |
| BDV, water content, or particulate is the diagnostic question | Diagnostic question is DGA trending, not dielectric integrity |
| First sample after an oil change, retrofill, or filtration intervention | Compact hermetic unit on natural ester or silicone where turbulent regime is physically out of reach at the available head pressure |
| Any reason to suspect the orifice has accumulated water or sludge | Oil loss per sampling event is a documented operational constraint (small-volume hermetic units, offshore logistics) |
Turbulent Reynolds is not a button you press. It is a flow condition that requires head pressure and low viscosity together, and on a passive hermetically sealed ester unit the combination can simply be out of reach. Forcing more flush volume does not summon turbulence that the head pressure cannot sustain; it only deepens the oil deficit the asset team has to make up afterwards. On a compact natural-ester transformer below about 5 MVA, a 1 200 mL sample bottle plus 2–5 L drain flush plus 1–2 L line flush plus a 2× container overflow pushes the per-event oil cost into the 6–9 L range. That is several sampling events away from forced refilling on a small sealed unit, and the asset team feels it.
The judgment call is not "ignore the standard." It is "know why the number is in the standard, and know whether the unit in front of you needs a different number." Sometimes the answer is that 5 L is still right — on an unfamiliar unit, after an intervention, or where dielectric strength is the question of the day. Sometimes the answer is that 1 L total is enough, the drain valve is clean, the trend is what we are after, and the oil is worth keeping in the tank. Either call is defensible when the reasoning is recorded with the sample.
That is what consulting expertise looks like — knowing why the number is in the standard, and knowing when the unit in front of you needs a different number.
7. Field checklist
For the technician at the valve:
- Use a drawn-aluminium bottle as the default — a 1 200 mL bottle for the full panel, a 120 mL bottle for DGA-only orders. Both are diagnostic-grade for DGA when topped correctly. Use a glass syringe only when the client's protocol calls for it, when a hydrogen-rich fault is under active investigation, or when field conditions make confident top-filling of the flexible bottle difficult.
- Top-filling discipline is the critical control. Press the sides of the aluminium bottle inward to expel residual air, fill to the brim, and screw the cap down inside the overflow stream. The bottle should be slightly bulged and contain no visible air gap. No exceptions, no "close enough."
- Sample at the bottom valve under representative load. Conservator-port samples are not equivalent.
- Run the flush in two stages as default: 2–5 L turbulent at the drain valve to mobilise accumulated water and particles (IEC 60475:2022 §4.2.1.3); then a further 1–2 L through the sampling line into a waste container to clear the dead-volume oil (§4.2.2.2). On compact hermetically sealed units (typically natural ester or silicone, below about 5 MVA), or on units with a documented sampling history and no current BDV or water-content concerns, 0.5–1 L total preflush with the sampling line connected is appropriate. Make this call deliberately, on the unit's history and physical configuration, not by default. When in doubt, flush the upper bound and document why.
- Bottom-fill through a hose. Do not pour through air.
- Overflow by at least twice the container volume.
- Cap the container inside the overflow stream. Rinse the cap in oil first.
- Transport the aluminium bottle upright, label visible, away from sunlight. If a glass syringe is in use, transport it with the plunger free to move (IEC 60475:2022 §4.2.2.1 b)).
The full step-by-step procedure with photos lives at our oil sampling guide. The diagnostic interpretation that the sample feeds into is at What your transformer oil is telling you. Once the gases reach the chromatograph cleanly, the Duval Triangle tool classifies the fault zone in seconds.
Try it yourself: Enter your DGA results in the Duval Triangle Tool and see which fault zone your transformer falls in. The tool assumes the sample is clean. The procedure above is what makes that assumption true.
The container is not a packaging detail. It is the first instrument in the diagnostic chain.
If you operate a fleet where DGA is the leading indicator for transformer health — wind, hydro, hyperscale data-centre, industrial cogeneration — and you want a sampling protocol benchmarked against the standards above and against your specific equipment population, contact us. The sampling kit, the protocol, the analytical chain, and the diagnostic conclusion are part of the engagement. We help asset teams build a sampling and interpretation chain that holds up under audit and produces conclusions you can defend on a post-mortem call.
Standards referenced
The methods on this page are anchored in these standards — follow each into our standards library.
Put Theory into Practice
Try our interactive Duval diagnostic tools or use our new unified workflow to analyze your transformer oil data.