Why the same oil gives different kV depending on how it is measured — and what that means for how you read a BDV result
❗ Important
Breakdown voltage (BDV) is not a constant of the oil. It is a statistical breakdown event at the electrode gap, governed by water, particles, and the shape of the field itself. Measure the same oil with three different electrode geometries and you get three different numbers — and they cannot be converted into one another. That is why limit tables are tied to one specific method, and why a BDV number with no method and no electrode gap stated cannot be interpreted.
What breakdown voltage actually is
Breakdown voltage is the voltage at which an insulating liquid stops insulating and lets a discharge cross the gap between two electrodes (IEC 60156:2024). It is the most important quick check of whether the oil still insulates properly. But the number is not a fundamental material constant of the oil. It measures the contaminants that pull the breakdown below the level clean oil would reach (IEC 60156:2024).
So what happens physically? Up to a certain point the oil holds the voltage and insulates (IEC 60156:2024). Push the voltage high enough and the insulation collapses. The breakdown itself is general field physics. When the field becomes strong enough, the free charges pick up so much speed that they trigger a chain reaction and form a conducting channel across the gap. That is the breakdown — a discharge that bridges the insulation between the electrodes completely and momentarily forces the voltage down toward zero (in high-voltage terminology a disruptive discharge, IEEE Std 4-2013). This sets breakdown apart from a partial discharge, which only punches through a small part of the insulation and does not cross the whole gap.
Finally, a breakdown is a statistical quantity, not a deterministic one. The individual event varies from measurement to measurement, which is why breakdown voltage is reported as the mean of typically six measurements together with their scatter (IEC 60156:2024; IEEE Std 4-2013). The central theme is already visible here: one number is the average of a scattered distribution — not a diagnosis in itself.
A breakdown is measured in a cell with a fixed, horizontal electrode gap — the two electrodes face each other across the oil.
Can the scatter be tamed?
The scatter is not just noise you have to live with — it is the very signal of contamination. So it is natural to ask whether you can measure in a way that dampens the random swings without masking the contamination you are after. That is exactly what IEC 60156:2024 opens the door to, with a new informative annex: an Annex A with an "improved test method" that may be used and is believed to reduce the scatter (IEC 60156:2024, Annex A). The cell is the same, the electrodes (2.5 mm) are the same, and the 2.0 kV/s ramp is the same — only the procedure itself changes. Note that Annex A is informative, not normative: it is a standardised option that laboratories increasingly adopt, not a requirement.
Three moves set the improved procedure apart from the classic one. First, a pre-energising: the voltage is taken up to 10 kV, held there for 10 seconds, and then ramped on to breakdown. Second, 10 shots instead of 6, with a trimmed mean — the two highest and two lowest are discarded, and the middle six are averaged. Third, an escalation: if the coefficient of variation is too high, a further ten shots are run (20 in total) and the middle twelve are averaged. The pause between shots is at least one minute.
Why those moves help follows from where the scatter comes from. Breakdown in oil is an inherently statistical process: free electrons are injected at random, and uncontrolled microbubbles, particles, and water content in the gap shift from shot to shot — each breakdown event leaves behind metal-vapour bubbles that can disturb the next (Baur et al. 2015; Baur et al. 2012). The pre-energising is believed to inject free electrons from the cathode into the liquid in advance — a trigger effect — so the breakdown becomes less dependent on the random first injection and therefore more deterministic (Baur et al. 2015). Trimming the outlying shots makes the mean robust against the bubble- and particle-driven swings (Baur et al. 2015). And the magnetic stirring that is already recommended anyway — and so is not a novelty of Annex A — flushes bubbles out of the gap between shots (Baur et al. 2012).
The effect is real, but must be read with caveats. The authors report a roughly three to four times smaller standard deviation when going from six to around twenty shots with trimming — for the two oil types they tested (Baur et al. 2015). And the improved cell improves the scatter from about 10% to 7% for high-quality oils (Baur et al. 2012). These are reported figures from a limited dataset, sample-dependent, not a guaranteed gain for every oil.

Classic six-shot measurement versus the informative Annex A procedure (IEC 60156:2024): ten shots, where the two highest and two lowest are discarded and the middle six form a narrower mean. Inset: the pre-energising holds the voltage at 10 kV for 10 s before the ramp continues to breakdown. Schematic, not to scale — no axis values.
This brings the article's argument full circle. The classic ±30% scatter on single measurements is not a property of the oil, but of the measurement setup. Change the procedure — pre-energising, more shots, trimming — and you change the number and its scatter, without the oil having moved at all. It is one more reminder that the method defines the number.
Why breakdown voltage is not one fixed number
Breakdown voltage is the most measured dielectric parameter on insulating liquids — and the most misread when laboratory reports are compared. Two BDV numbers on the same oil can sit 20–30 kV apart, purely because they were measured with different electrode geometries. That is not measurement error. It is the physics behind the test.
A breakdown is not the expression of a fixed material property of the oil. It is an event: at a certain voltage the liquid collapses between two electrodes. When that happens is decided not only by the oil's cleanliness, but also by how sharply the field concentrates at the electrodes, how large the electrode gap is, how fast the voltage is ramped up, and how many breakdowns you average over. The test responds first and foremost to free water and particles — fibres, wear particles, conductive carbon — and especially to the combination, where particles with a water film shorten the distance the oil has to insulate across. It says very little about dissolved, polar contaminants that have not yet gathered into droplets or particles.
The consequence is simple: change the geometry and you change the number — on the same oil. That is why the method must travel with the result, every time.
The particles that shorten the distance
It is worth looking more closely at how particles pull the breakdown voltage down. It explains exactly why BDV is so sensitive to the combination of water and particles. Particles — fibres, moist cellulose, conductive wear particles — always lower the average breakdown voltage; how much depends on the sample and varies widely (CIGRE TB 157:2000).
Particles do not sit passively in the field. A conductive or polarisable particle acquires an induced dipole moment, aligns with the field, and is drawn toward the regions where the field is strongest. The particles also attract one another end to end and gather into short, field-aligned clusters.
But they do not need to form a continuous bridge from electrode to electrode to do damage. Each particle acts almost like a small conductive stepping-stone — a region with almost no voltage drop across the particle itself. The voltage that used to distribute evenly across the whole gap is instead squeezed into the short oil gaps between the particles. It is in these short gaps that the field becomes strongly intensified, and it is here that the breakdown can start and spread — from stepping-stone to stepping-stone, like stepping stones across a stream.
The result is that the stretch of oil that actually has to insulate is no longer the whole physical electrode gap, but the sum of the short gaps between the stepping-stones. The oil therefore collapses at a lower voltage than a clean gap would require — not because the oil is poorer, but because the stepping-stones have shortened the stretch the oil has to insulate across.
Moisture amplifies the effect markedly. A water film on the fibres makes them far more conductive and therefore far more effective as stepping-stones, and this is where the breakdown voltage falls most steeply (CIGRE TB 157:2000). That is the core of why BDV reacts so strongly precisely to the combination of water and particles: separately they each pull the number down, but together they really shorten the distance the oil has to insulate across.

Particles act as stepping-stones: each has almost no voltage drop across it, so the field is squeezed into the short oil gaps in between. The stretch the oil actually has to insulate across becomes the sum of those gaps — shorter than the physical electrode gap — and the oil collapses at a lower voltage. Moisture on the particles amplifies the effect. Schematic — not to scale.
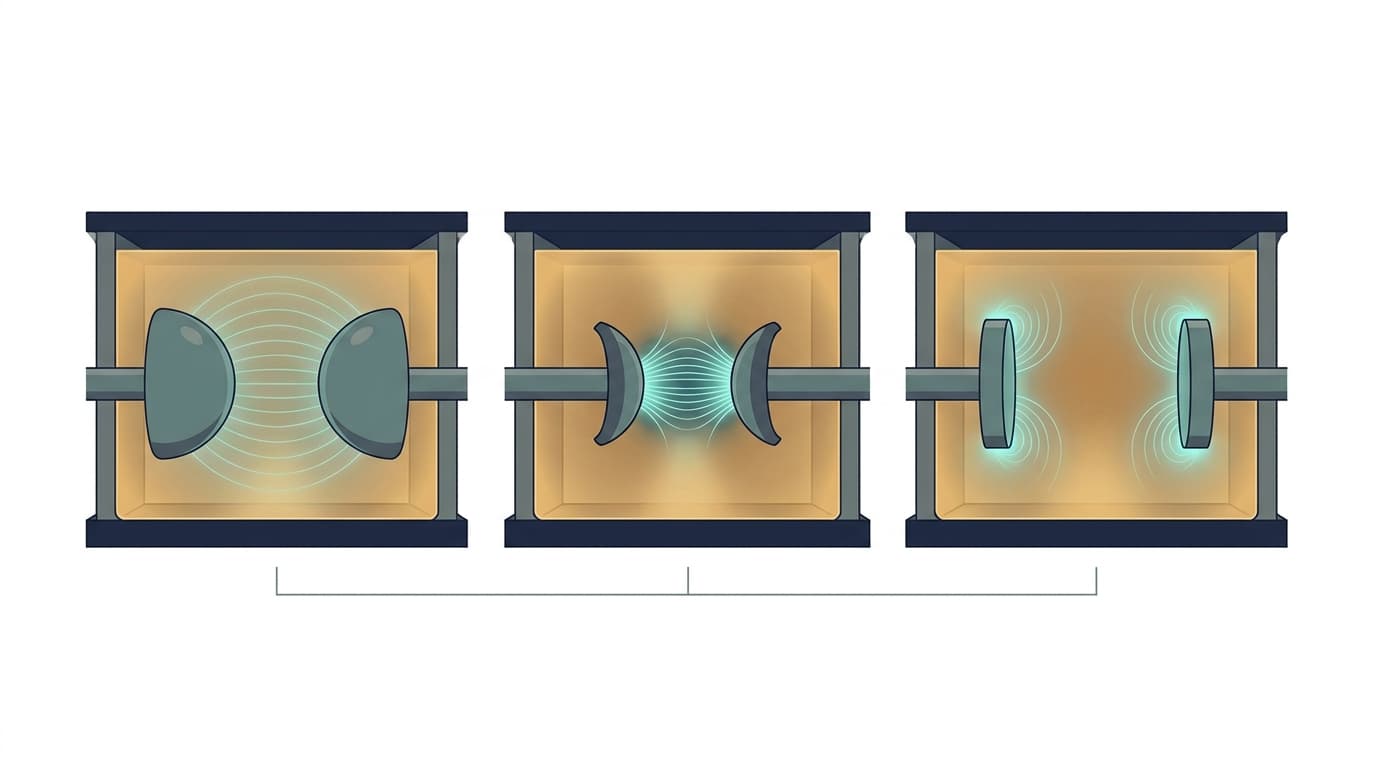
Same oil, three geometries
Three standards measure the same physical event — the AC voltage at which the liquid collapses — but each with its own electrode and its own electrode gap:
| Method | Electrode | Electrode gap | Voltage ramp |
|---|---|---|---|
| IEC 60156 | Partly hemispherical mushroom (25 mm radius) | 2.50 mm | 2.0 kV/s |
| ASTM D1816 | VDE mushroom (sharp shoulder) | 2.0 mm (alt. 1.0 mm) | 0.5 kV/s |
| ASTM D877 | Flat disc with sharp edges | 2.54 mm | — |
The three geometries shape the field very differently. IEC 60156's rounded mushroom gives a fairly uniform field across a large electrode gap. ASTM D1816's VDE mushroom concentrates the field more sharply — which makes the method more sensitive to particle contamination, but gives systematically lower absolute numbers. ASTM D877's flat disc looks at first like a uniform field, but the sharp disc edges create local field concentrations that shift the breakdown voltage.
Three genuine geometries, three different fields at the gap — and therefore three different numbers on the same sample.

Same oil, three electrode geometries. The field at the gap looks different in each method — and it is the field that decides at what voltage the oil collapses.
Why the numbers cannot be converted
Here is the mistake most people fall into: the temptation to convert one number into the other with a simple multiplier. You cannot. There is no standardised formula for converting between the methods — no standards body publishes one, and there is a reason for that.
For illustration: an acceptance limit around 60 kV measured with IEC 60156 corresponds roughly to 35–40 kV measured with ASTM D1816 at 2 mm. But that is an order of magnitude, not a conversion. The difference between the two numbers depends on what is contaminating the oil. If the oil is clean and dry, the difference is small. If the oil is mainly degraded by moisture, IEC 60156 typically shows considerably higher values than ASTM D1816. If it is particle-dominated, the difference can become even larger, because the sharp VDE mushroom amplifies the effect of particles that shorten the gap. A single conversion factor would therefore misclassify precisely the samples where the diagnosis matters most.
This has a concrete consequence when a laboratory switches method partway through a unit's history: a method change is a break in the reference — on a par with a filtration — not a change in the oil's condition. The number falls or rises without the oil having changed. The two methods' numbers must therefore be tracked separately, and each held up against its own limit table.
That is why limit tables are method-specific
When there is no bridge between the numbers, a limit cannot be method-neutral either. A "Good" limit is only meaningful together with the method it was set for. A limit set for IEC 60156 must be read against IEC 60156 results; a limit set for ASTM D1816 against D1816 results. To mix them is to compare two different events.
It is also the reason new oil on receipt is measured a particular way today. For new oil on receipt, ASTM D877 is no longer applicable; here ASTM D1816 is to be used, and ASTM recommends moving all testing to D1816. Note the nuance: ASTM D877 has not been abolished — the standard is active and continues to cover liquids in service. The point is narrow: for the specific receipt-inspection of new oil, it is D1816 that applies.
What the lab gap actually tells you about the transformer
One last, important caveat. The few millimetres between the electrodes in the lab cell say nothing directly about how well the transformer itself insulates. The lab gap is a proxy — a screening for contamination, primarily water and particles.
The transformer's own ability to withstand voltage depends on the entire geometry of its insulation: the oil-paper interface, the distances between windings and earth, and how the field distributes through a construction that is infinitely more complex than two electrodes in a beaker. A low BDV number is a signal that the oil is contaminated — not a direct measurement of how close the transformer is to breaking down. The test is valuable and important, but it must be understood for what it is: an indicator of the oil's cleanliness.
Moisture and breakdown voltage belong together
The single factor that most often pulls BDV down is water — and the relationship is steeper than many expect. Breakdown voltage starts to fall markedly long before the oil is saturated.

Breakdown voltage versus oil relative saturation (%RS), digitised from CIGRE TB 741 (2018), Fig. 1.3. The y-axis is breakdown voltage measured per IEC 60156 (2.5 mm gap) — here too the method travels with the number. The curve applies to clean oil with no solid insulation and is similar across the different insulating liquids; it is plotted against water activity (%RS), so no temperature is attached to it. It is an illustration of the non-linear relationship — not a conversion formula.
Note that the curve is plotted against relative saturation (%RS), not against an absolute water content in ppm. That is deliberate: the same amount of water in ppm gives a wildly different dielectric risk at different temperatures, because the oil's saturation limit moves with temperature. The curve here applies to clean oil alone, without paper, and is common across the different insulating liquids — it is an illustration of the shape of the relationship, not a look-up table for mineral oil at a particular temperature.
The point for practice is that water and breakdown voltage must always be assessed together. It is precisely the breakdown voltage that the water threatens.
How to read a BDV result
- Always require the method and electrode gap together with the number. Because two methods give systematically different numbers, the method and gap are a precondition for a BDV result to be assessable at all — not a formality. A number without that information cannot be interpreted.
- Never convert between the methods. There is no standardised formula, and "multiply by one and a half" misclassifies exactly the contaminated samples where the diagnosis matters most.
- Track each method on its own. If a laboratory switches method, treat it as a break in the reference and hold each series up against its own limit table.
- Read BDV as a screening, not as the transformer's withstand strength. A low number points to contamination with water or particles — not directly to how close the unit is to a breakdown.
- Always assess water and breakdown voltage together, and supplement with acid number, interfacial tension, and dielectric dissipation factor. One parameter does not make the diagnosis; the combination does.
The short version: the test method defines the number. A BDV result is only usable once you know how it was measured.
💡 Tip
Getting BDV numbers from several laboratories on the same unit? If they come with no method and electrode gap stated, they cannot be compared — let alone converted. That is exactly the kind of reference break we catch in an independent review of your analysis history, before it turns into a wrong decision. Get in touch if you want a second eye on whether your BDV series can actually be compared.
Standards referenced
The methods on this page are anchored in these standards — follow each into our standards library.
Put Theory into Practice
Try our interactive Duval diagnostic tools or use our new unified workflow to analyze your transformer oil data.